435 Homes
Forney, TX homes sold within the last 90 days
In the last 30 days, Forney home prices were up 7.2% compared to last year. The median price of a home was $355,900. View Forney Market Insights
1 / 1
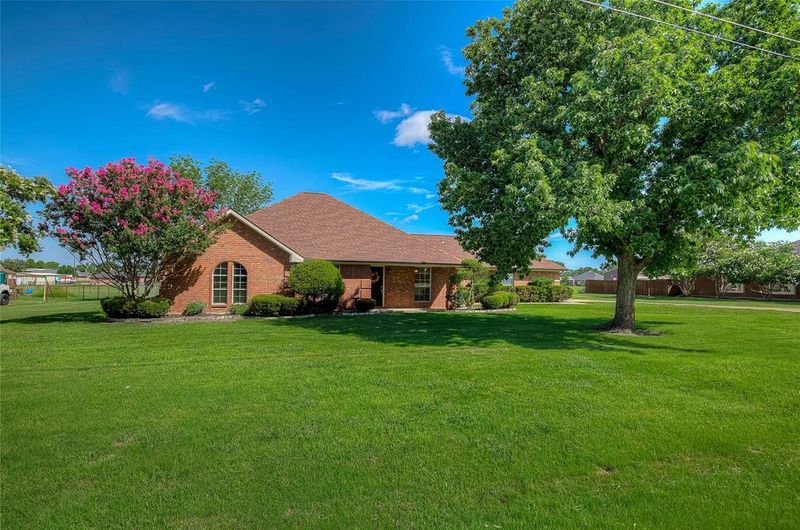
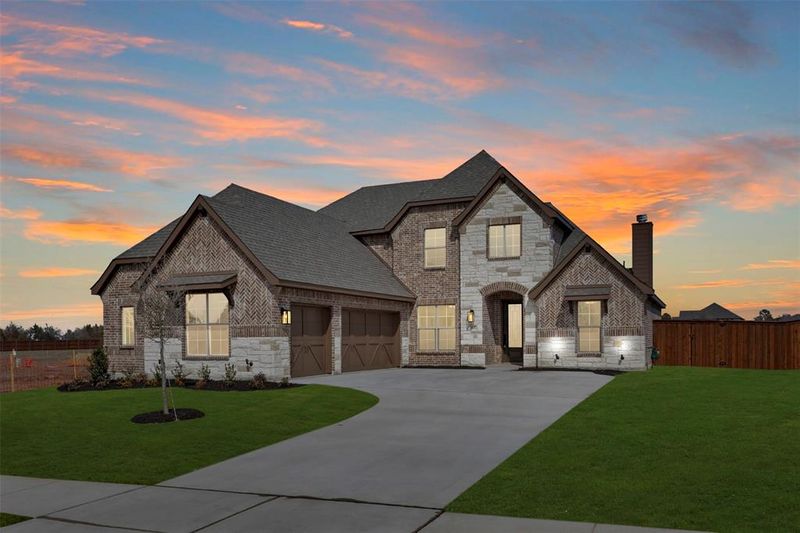
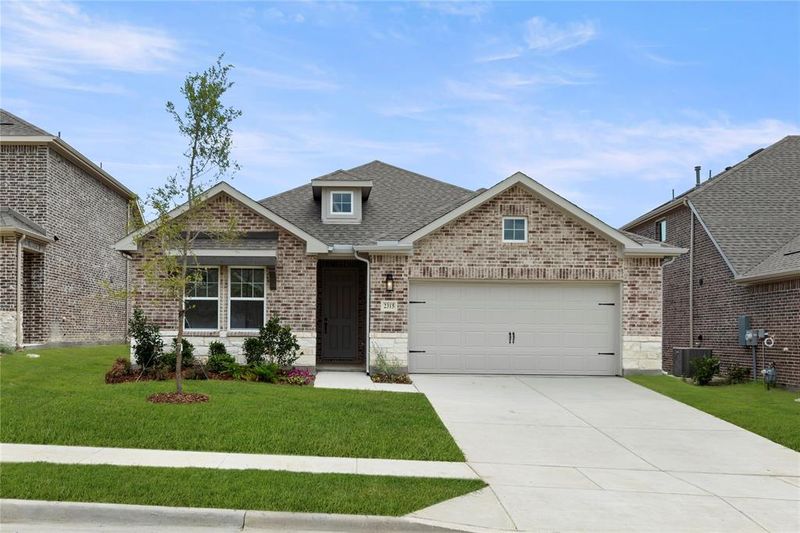
Sold Oct 31, 2025
$414,900
Last List Price
1 / 1
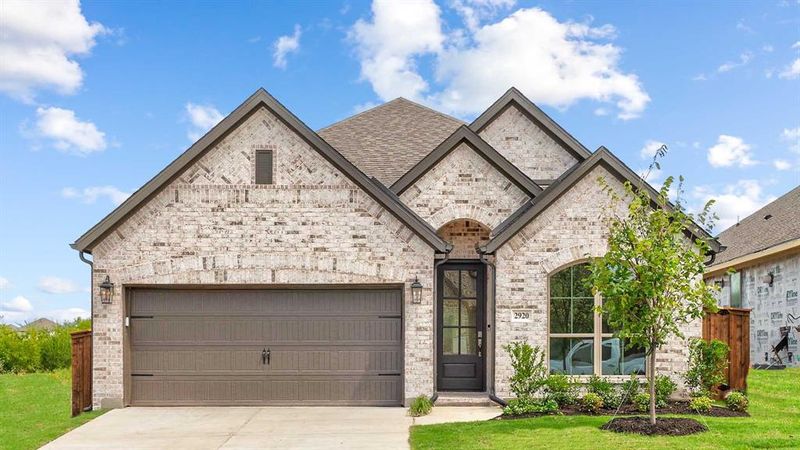
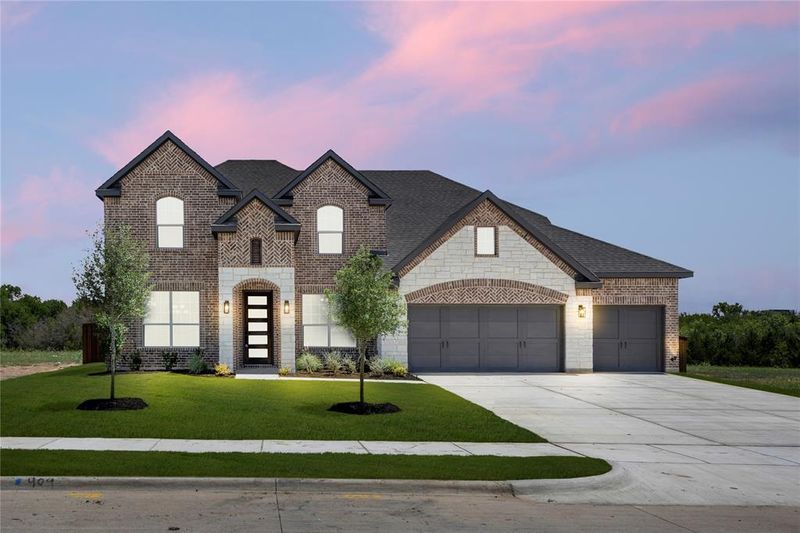
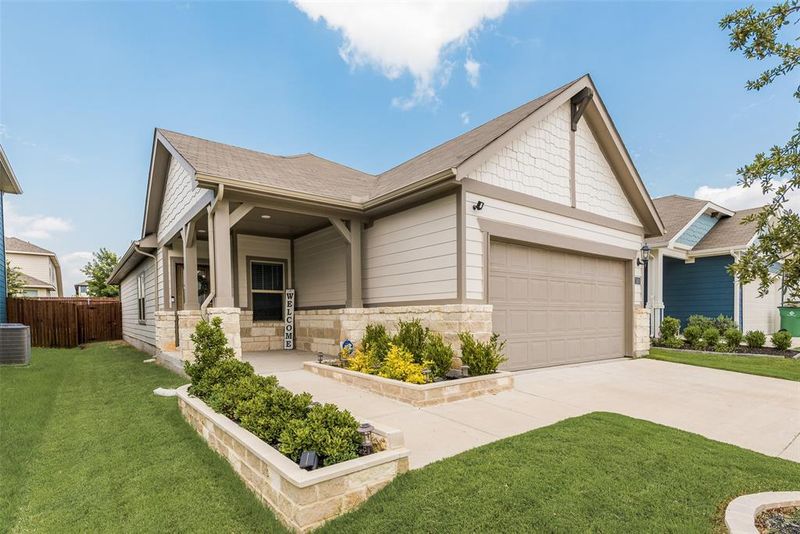
Sold Oct 31, 2025
$374,900
Last List Price

1 / 1
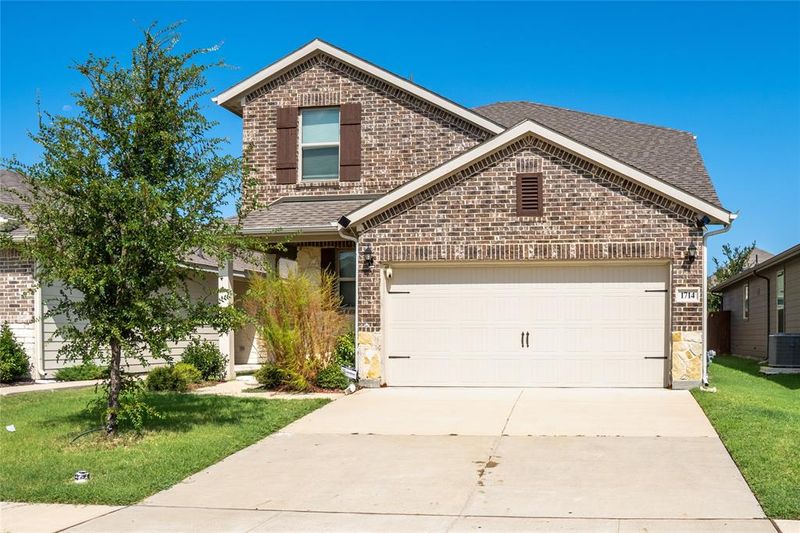
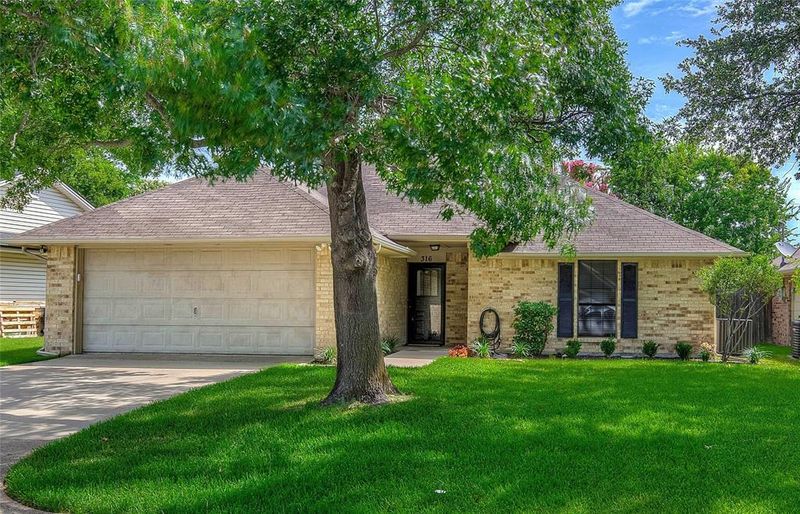
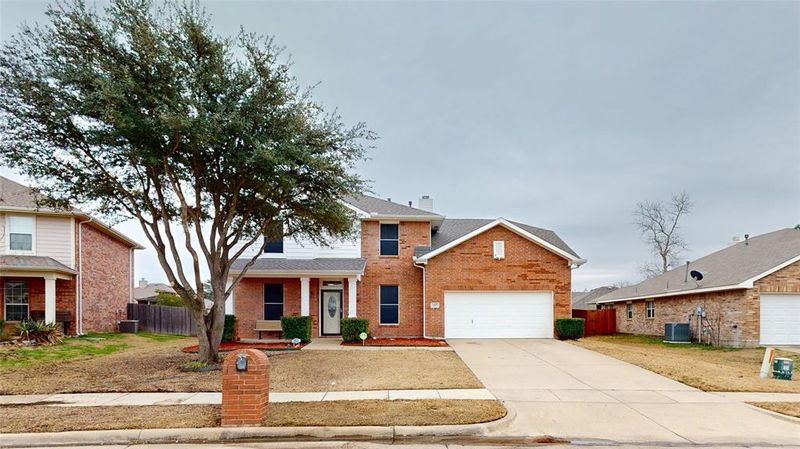
Sold Oct 31, 2025
$360,000
Last List Price

1 / 1
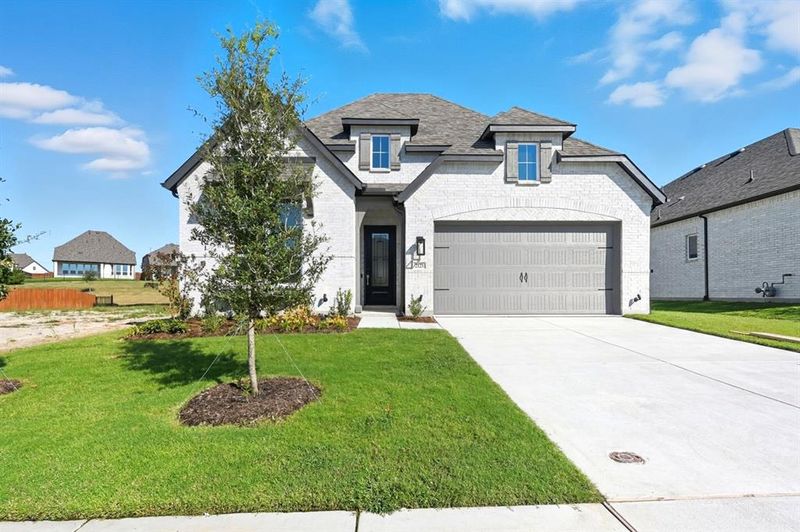
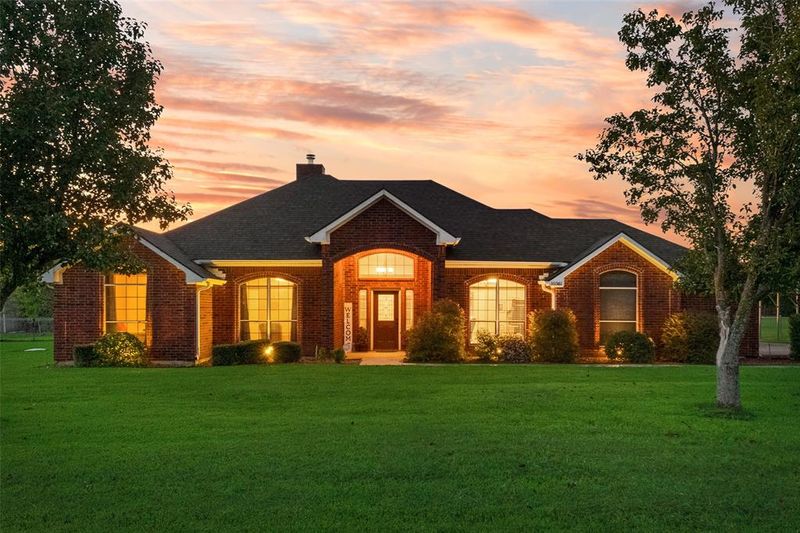
Sold Oct 31, 2025
$250,000
Last List Price
1 / 1
Sold Oct 31, 2025
$350,000
Last List Price

1 / 1
Sold Oct 31, 2025
$384,890
Last List Price

1 / 1
Sold Oct 31, 2025
$299,990
Last List Price

1 / 1
Sold Oct 31, 2025
$379,990
Last List Price
1 / 1
Sold Oct 30, 2025
$399,000
Last List Price
1 / 1
Sold Oct 30, 2025
$215,000
Last List Price

1 / 1
Sold Oct 30, 2025
$243,749
Last List Price
1 / 1
Sold Oct 30, 2025
$319,990
Last List Price
1 / 1
Sold Oct 30, 2025
$239,999
Last List Price
1 / 1
Sold Oct 30, 2025
$319,900
Last List Price
1 / 1
Sold Oct 30, 2025
$276,274
Last List Price
1 / 1
Sold Oct 30, 2025
$364,990
Last List Price
1 / 1
Sold Oct 30, 2025
$449,900
Last List Price

1 / 1
Sold Oct 29, 2025
$320,000
Last List Price

1 / 1
Sold Oct 29, 2025
$228,849
Last List Price

1 / 1
Sold Oct 29, 2025
$223,349
Last List Price
1 / 1
Sold Oct 29, 2025
$299,997
Last List Price
1 / 1
Sold Oct 29, 2025
$519,999
Last List Price
1 / 1
Sold Oct 29, 2025
$534,888
Last List Price
1 / 1
Sold Oct 28, 2025
$250,000
Last List Price
1 / 1
Sold Oct 28, 2025
$445,000
Last List Price
1 / 1
Sold Oct 28, 2025
$359,899
Last List Price
1 / 1
Sold Oct 28, 2025
$399,900
Last List Price

1 / 1
Sold Oct 28, 2025
$239,900
Last List Price

1 / 1
Sold Oct 28, 2025
$422,000
Last List Price

1 / 1
Sold Oct 28, 2025
$437,911
Last List Price
1 / 1
Sold Oct 27, 2025
$535,000
Last List Price
1 / 1
Sold Oct 27, 2025
$324,498
Last List Price

1 / 1
Sold Oct 27, 2025
$399,888
Last List Price
1 / 1
Sold Oct 24, 2025
$369,000
Last List Price
1 / 1
Sold Oct 24, 2025
$260,000
Last List Price
1 / 1
Sold Oct 24, 2025
$365,000
Last List Price
Viewing 1-36 of 435 homes
Forney Market Trends
All Home Types
In the last 30 days, homes for sale in Forney, TX sold for a median price of $355,900, up 7.2% compared to the same period last year. The median price per square foot was $166.22, up 2.2% year-over-year. There were 70 homes sold, down from 154 last year.
Median Sale Price
$355,900
+7.2% year-over-year
Median Price per Sq. Ft.
$166.22
+2.2% year-over-year
Number of Homes Sold
70
-54.5% year-over-year
Frequently Asked Questions
What is the median home sale price in Forney, TX?
In the last 30 days, the median home sale price in Forney was $355,900, up 7.2% compared to the same period last year. The "median" price is the middle price - half of the homes here were sold for less, the other half for more.
How many homes are for sale in Forney, TX?
There were 888 homes for sale in Forney as of November 01, 2025. There were 183 new listings within the last 30 days as well. The more homes on the market, the more choices buyers have.
What are some of the most popular neighborhoods in Forney, TX?
According to our listings, you'll find the most homes currently available in Forney in the popular neighborhood Brookville Estates.
How up-to-date are Orchard's new listings in Forney, TX?
The new homes and houses for sale on Orchard's listings pages are updated hundreds of times each day, with listings in Forney last seen updated at . New listings can appear every day, but many listings first appear on the market mid-week.
How much competition is there to buy a home in Forney, TX?
In the last 30 days, the median number of days a home in Forney remained on the market (DOM) was 80. In areas with a low DOM, homes are sold quickly and the competition is fierce; in areas with higher DOMs, you may have more options and more time to make an offer.