12,219 Homes
Recently sold homes in Forney, TX under $700,000
In the last 30 days, Forney home prices were down 0.5% compared to last year. The median price of a home was $347,450. View Forney Market Insights
1 / 1
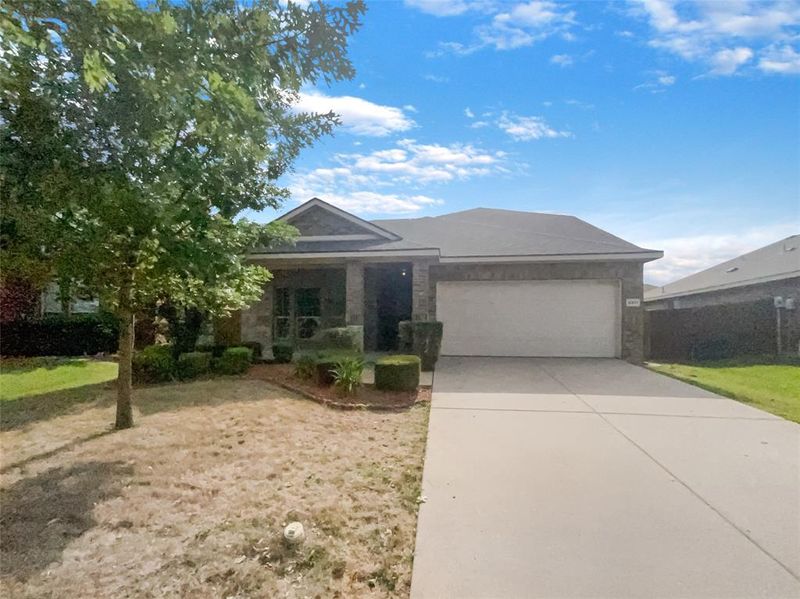
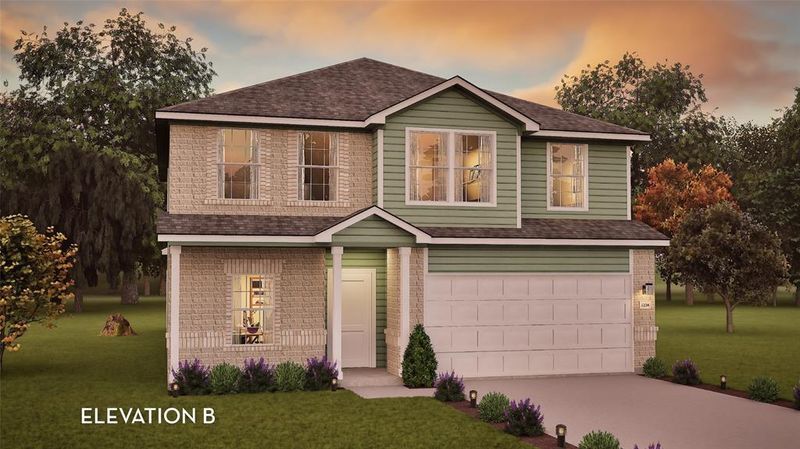
Sold Sep 08, 2025
$270,000
Last List Price
1 / 1
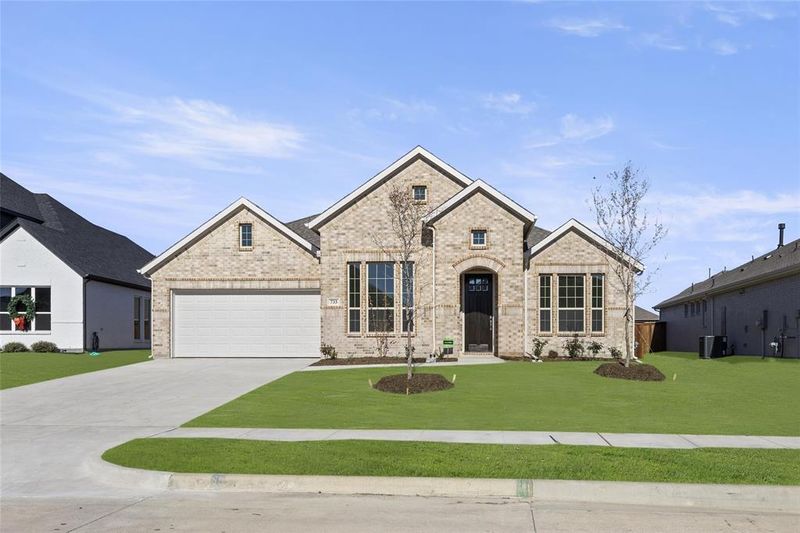
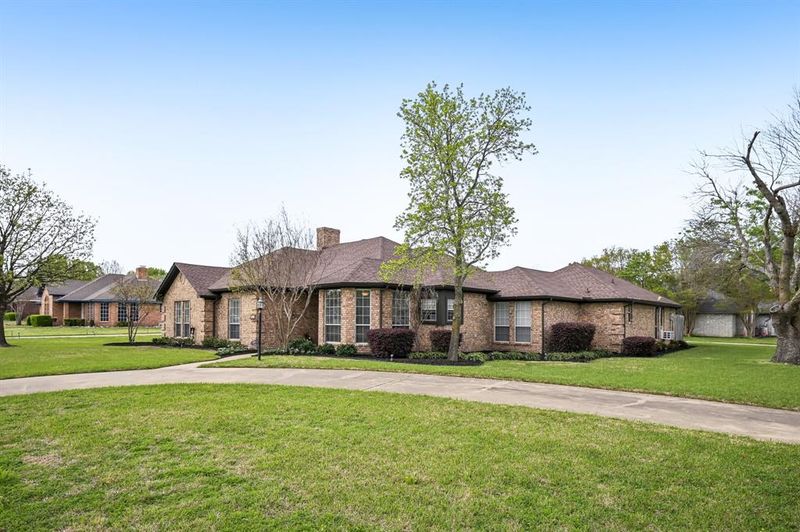
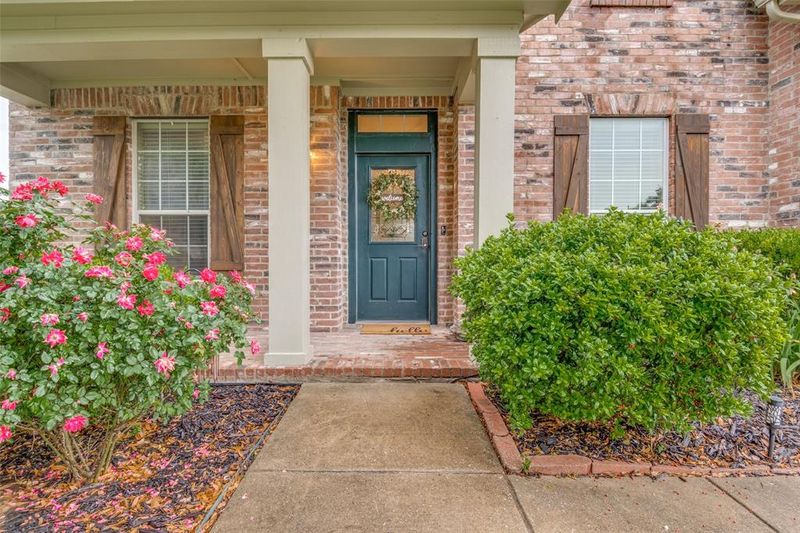
Sold Sep 08, 2025
$489,990
Last List Price
1 / 1
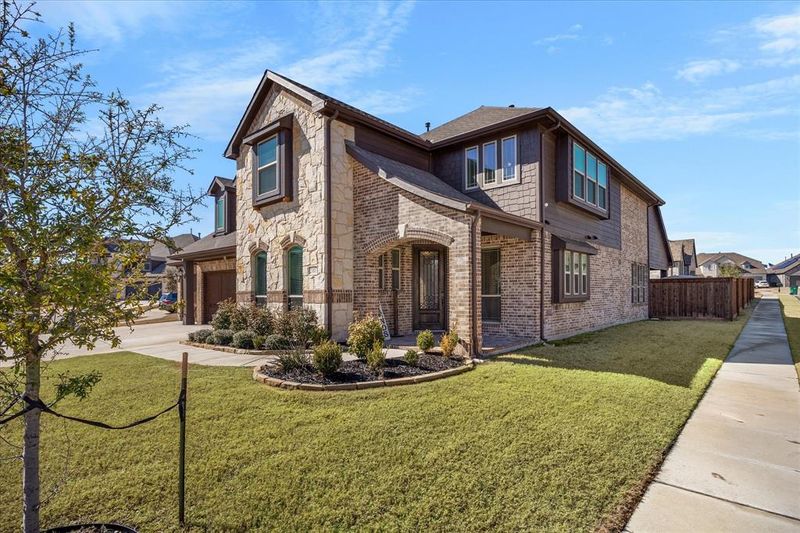
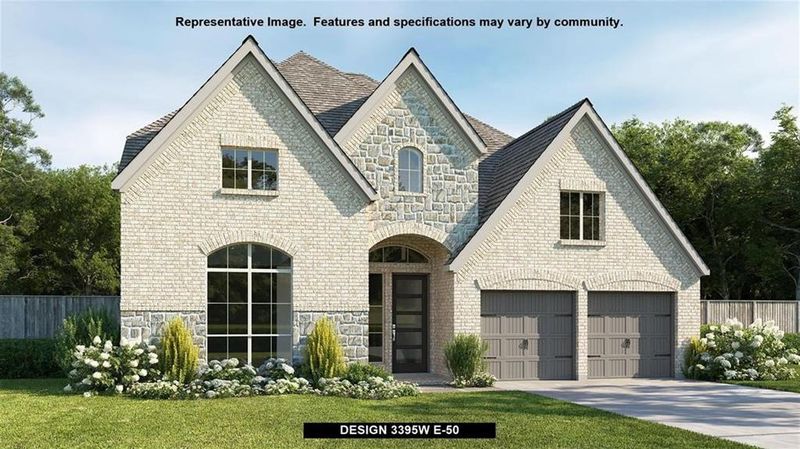
Sold Sep 05, 2025
$667,950
Last List Price
1 / 1
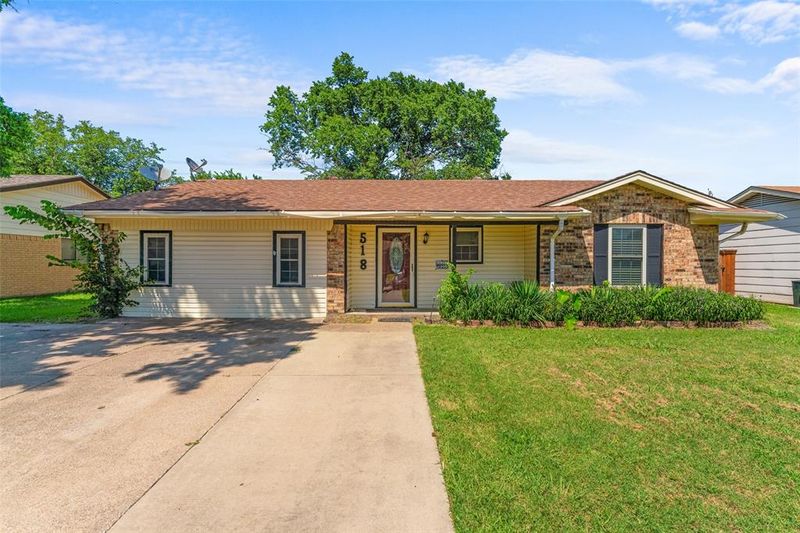
Sold Sep 05, 2025
$349,000
Last List Price
1 / 1
Sold Sep 05, 2025
$289,000
Last List Price
1 / 1
Sold Sep 05, 2025
$219,000
Last List Price
1 / 1
Sold Sep 04, 2025
$389,350
Last List Price
1 / 1
Sold Sep 04, 2025
$574,900
Last List Price
1 / 1
Sold Sep 04, 2025
$569,950
Last List Price
1 / 1
Sold Sep 03, 2025
$381,670
Last List Price
1 / 1
Sold Sep 03, 2025
$325,000
Last List Price
1 / 1
Sold Sep 03, 2025
$299,990
Last List Price
1 / 1
Sold Sep 02, 2025
$279,000
Last List Price
1 / 1
Sold Sep 02, 2025
$554,000
Last List Price
1 / 1
Sold Sep 02, 2025
$241,644
Last List Price
1 / 1
Sold Sep 01, 2025
$402,056
Last List Price
1 / 1
Sold Sep 01, 2025
$395,378
Last List Price
1 / 1
Sold Aug 29, 2025
$420,000
Last List Price
1 / 1
Sold Aug 29, 2025
$369,900
Last List Price
1 / 1
Sold Aug 29, 2025
$653,900
Last List Price
1 / 1
Sold Aug 29, 2025
$698,900
Last List Price
1 / 1
Sold Aug 29, 2025
$219,000
Last List Price
1 / 1
Sold Aug 29, 2025
$249,500
Last List Price
1 / 1
Sold Aug 29, 2025
$455,000
Last List Price
1 / 1
Sold Aug 29, 2025
$362,000
Last List Price
1 / 1
Sold Aug 29, 2025
$255,000
Last List Price
1 / 1
Sold Aug 29, 2025
$250,000
Last List Price
1 / 1
Sold Aug 29, 2025
$317,090
Last List Price
1 / 1
Sold Aug 29, 2025
$445,000
Last List Price

Sold Aug 29, 2025
$290,000
Last List Price
1 / 1
Sold Aug 29, 2025
$285,000
Last List Price
1 / 1
Sold Aug 29, 2025
$484,900
Last List Price
1 / 1
Sold Aug 29, 2025
$365,000
Last List Price
1 / 1
Sold Aug 29, 2025
$314,999
Last List Price
1 / 1
Sold Aug 29, 2025
$360,000
Last List Price
1 / 1
Sold Aug 29, 2025
$495,598
Last List Price
Viewing 1-36 of 12,219 homes
Forney Market Trends
All Home Types
In the last 30 days, homes for sale in Forney, TX sold for a median price of $347,450, down 0.5% compared to the same period last year. The median price per square foot was $154.12, down 6.3% year-over-year. There were 117 homes sold, down from 190 last year.
Median Sale Price
$347,450
-0.5% year-over-year
Median Price per Sq. Ft.
$154.12
-6.3% year-over-year
Number of Homes Sold
117
-38.4% year-over-year
Frequently Asked Questions
What is the median home sale price in Forney, TX?
In the last 30 days, the median home sale price in Forney was $347,450, down 0.5% compared to the same period last year. The "median" price is the middle price - half of the homes here were sold for less, the other half for more.
How many homes are for sale in Forney, TX?
There were 979 homes for sale in Forney as of September 08, 2025. There were 137 new listings within the last 30 days as well. The more homes on the market, the more choices buyers have.
What are some of the most popular neighborhoods in Forney, TX?
According to our listings, you'll find the most homes currently available in Forney in the popular neighborhood The Villages of Fox Hollow.
How up-to-date are Orchard's new listings in Forney, TX?
The new homes and houses for sale on Orchard's listings pages are updated hundreds of times each day, with listings in Forney last seen updated at . New listings can appear every day, but many listings first appear on the market mid-week.
How much competition is there to buy a home in Forney, TX?
In the last 30 days, the median number of days a home in Forney remained on the market (DOM) was 74. In areas with a low DOM, homes are sold quickly and the competition is fierce; in areas with higher DOMs, you may have more options and more time to make an offer.