10,912 Homes
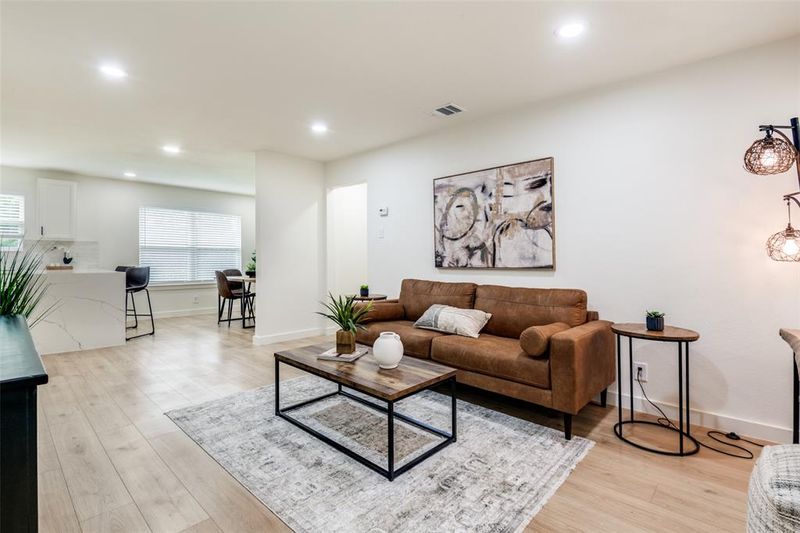
Recently sold homes in Rockwall County, TX under $500,000
In the last 30 days, Rockwall County home prices were up 2.3% compared to last year. The median price of a home was $415,000. View Rockwall County Market Insights
1 / 1
Sold Jul 29, 2025
$298,999
Last List Price
1 / 1
Sold Jul 29, 2025
$434,900
Last List Price
1 / 1
Sold Jul 29, 2025
$325,000
Last List Price
1 / 1
Sold Jul 28, 2025
$424,900
Last List Price
1 / 1
Sold Jul 28, 2025
$415,000
Last List Price
1 / 1
Sold Jul 28, 2025
$359,500
Last List Price
1 / 1
Sold Jul 28, 2025
$430,000
Last List Price
1 / 1
Sold Jul 28, 2025
$285,000
Last List Price
1 / 1
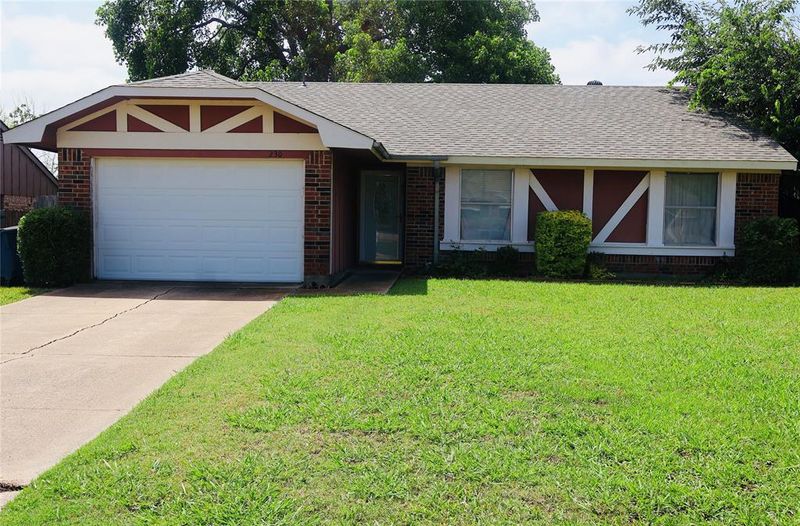
Sold Jul 28, 2025
$230,000
Last List Price
1 / 1
Sold Jul 28, 2025
$318,000
Last List Price
1 / 1
Sold Jul 28, 2025
$275,000
Last List Price
1 / 1
Sold Jul 28, 2025
$455,000
Last List Price
1 / 1
Sold Jul 25, 2025
$355,000
Last List Price
1 / 1
Sold Jul 25, 2025
$484,500
Last List Price
1 / 1
Sold Jul 25, 2025
$372,490
Last List Price
1 / 1
Sold Jul 25, 2025
$349,490
Last List Price
1 / 1
Sold Jul 25, 2025
$279,900
Last List Price
1 / 1
Sold Jul 25, 2025
$349,990
Last List Price
1 / 1
Sold Jul 25, 2025
$189,000
Last List Price
1 / 1
Sold Jul 25, 2025
$419,999
Last List Price
1 / 1
Sold Jul 25, 2025
$384,900
Last List Price
1 / 1
Sold Jul 25, 2025
$495,000
Last List Price
1 / 1
Sold Jul 25, 2025
$399,900
Last List Price
1 / 1
Sold Jul 24, 2025
$309,999
Last List Price
1 / 1
Sold Jul 24, 2025
$280,000
Last List Price
1 / 1
Sold Jul 24, 2025
$398,900
Last List Price
1 / 1
Sold Jul 23, 2025
$420,900
Last List Price
1 / 1
Sold Jul 23, 2025
$370,000
Last List Price
1 / 1
Sold Jul 23, 2025
$320,000
Last List Price
1 / 1
Sold Jul 23, 2025
$220,000
Last List Price
1 / 1
Sold Jul 22, 2025
$440,000
Last List Price

1 / 1
Sold Jul 21, 2025
$329,900
Last List Price

1 / 1
Sold Jul 21, 2025
$350,000
Last List Price
1 / 1
Sold Jul 21, 2025
$419,900
Last List Price
1 / 1
Sold Jul 18, 2025
$205,000
Last List Price
1 / 1
Sold Jul 18, 2025
$430,656
Last List Price
Viewing 145-180 of 10,912 homes
Rockwall County Market Trends
All Home Types
In the last 30 days, homes for sale in Rockwall County, TX sold for a median price of $415,000, up 2.3% compared to the same period last year. The median price per square foot was $189.12, up 3.1% year-over-year. There were 95 homes sold, down from 203 last year.
Median Sale Price
$415,000
+2.3% year-over-year
Median Price per Sq. Ft.
$189.12
+3.1% year-over-year
Number of Homes Sold
95
-53.2% year-over-year
Frequently Asked Questions
What is the median home sale price in Rockwall County, TX?
In the last 30 days, the median home sale price in Rockwall County was $415,000, up 2.3% compared to the same period last year. The "median" price is the middle price - half of the homes here were sold for less, the other half for more.
How many homes are for sale in Rockwall County, TX?
There were 1,262 homes for sale in Rockwall County as of September 07, 2025. There were 154 new listings within the last 30 days as well. The more homes on the market, the more choices buyers have.
What are some of the most popular neighborhoods in Rockwall County, TX?
According to our listings, you'll find the most homes currently available in Rockwall County in these popular neighborhoods: Woodcreek, The Shores, and Chandlers Landing.
How up-to-date are Orchard's new listings in Rockwall County, TX?
The new homes and houses for sale on Orchard's listings pages are updated hundreds of times each day, with listings in Rockwall County last seen updated at . New listings can appear every day, but many listings first appear on the market mid-week.
How much competition is there to buy a home in Rockwall County, TX?
In the last 30 days, the median number of days a home in Rockwall County remained on the market (DOM) was 47.33. In areas with a low DOM, homes are sold quickly and the competition is fierce; in areas with higher DOMs, you may have more options and more time to make an offer.