2,276 Homes
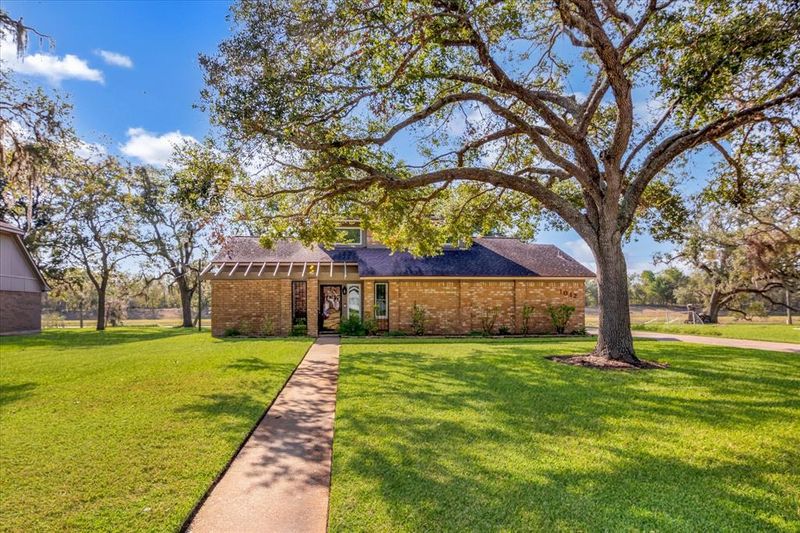
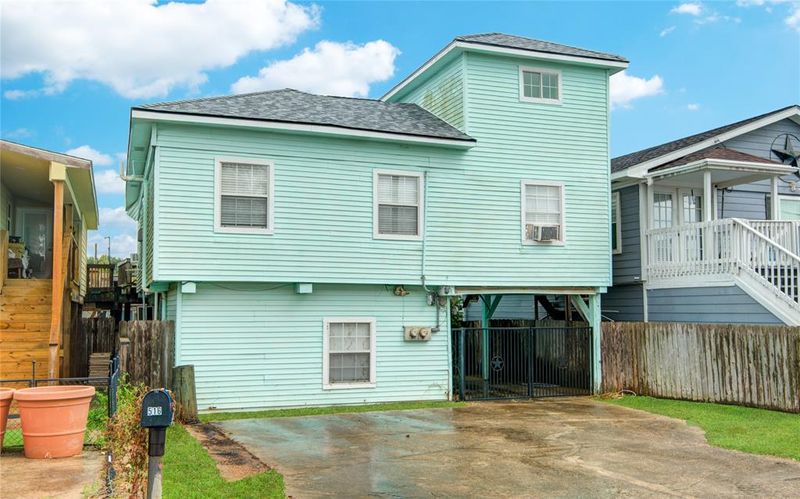
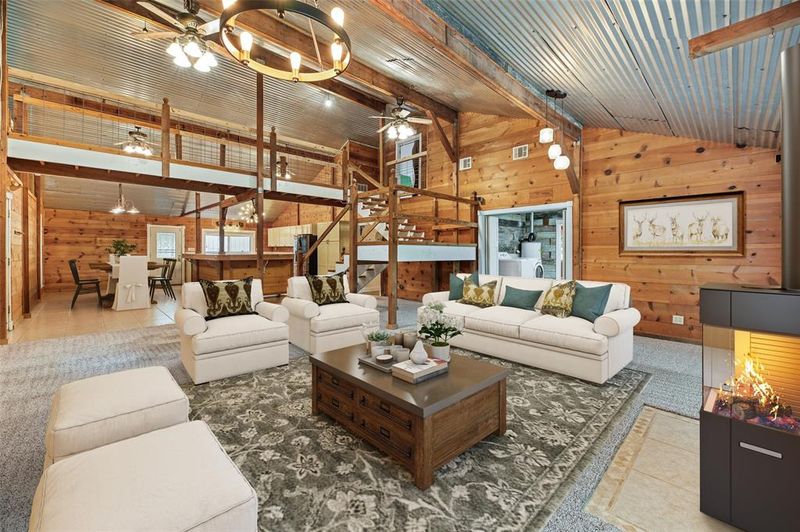
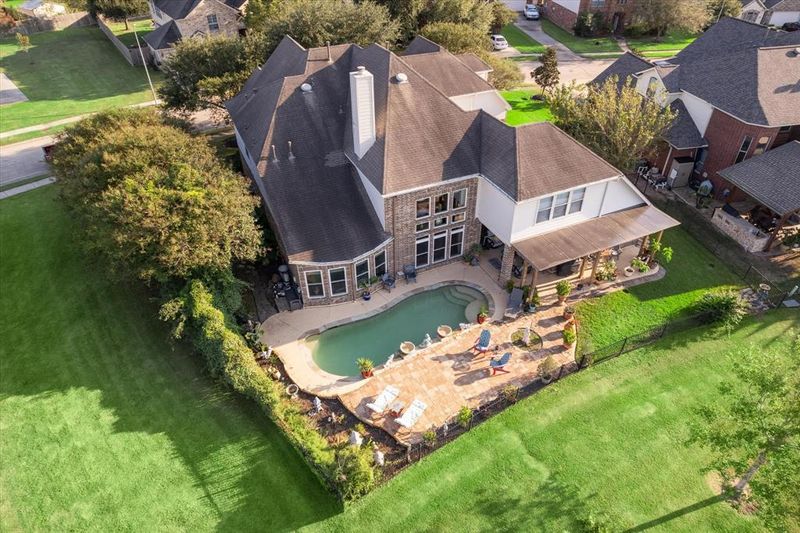
Recently sold homes in Brazoria County, TX on a Waterfront
In the last 30 days, Brazoria County home prices were down 1.9% compared to last year. The median price of a home was $342,297. View Brazoria County Market Insights
1 / 34
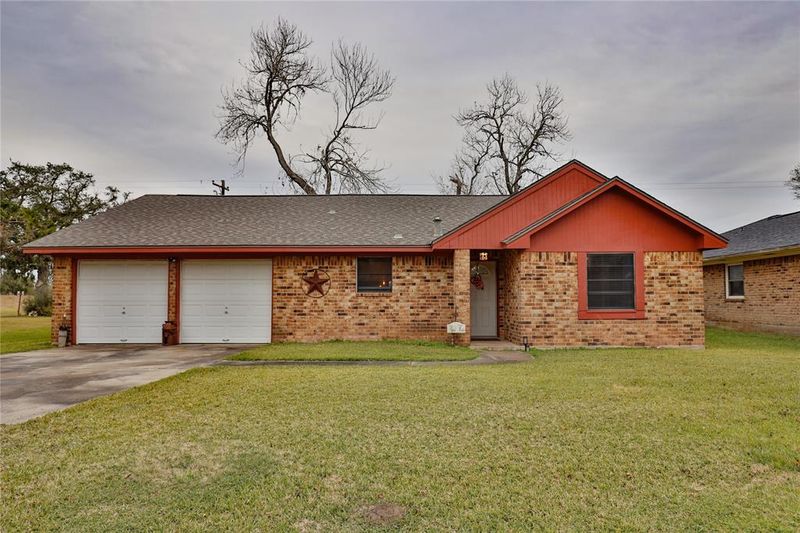
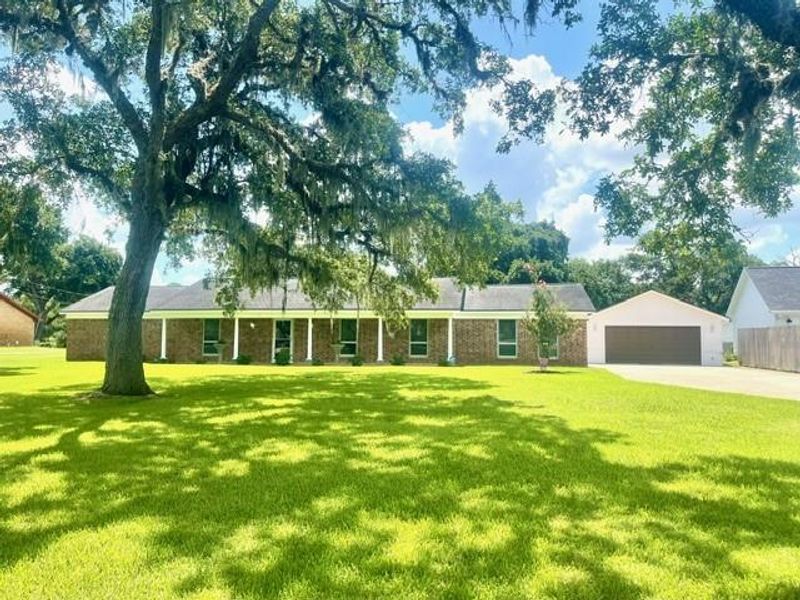
Sold Mar 19, 2025
$240,000
Last List Price
1 / 21
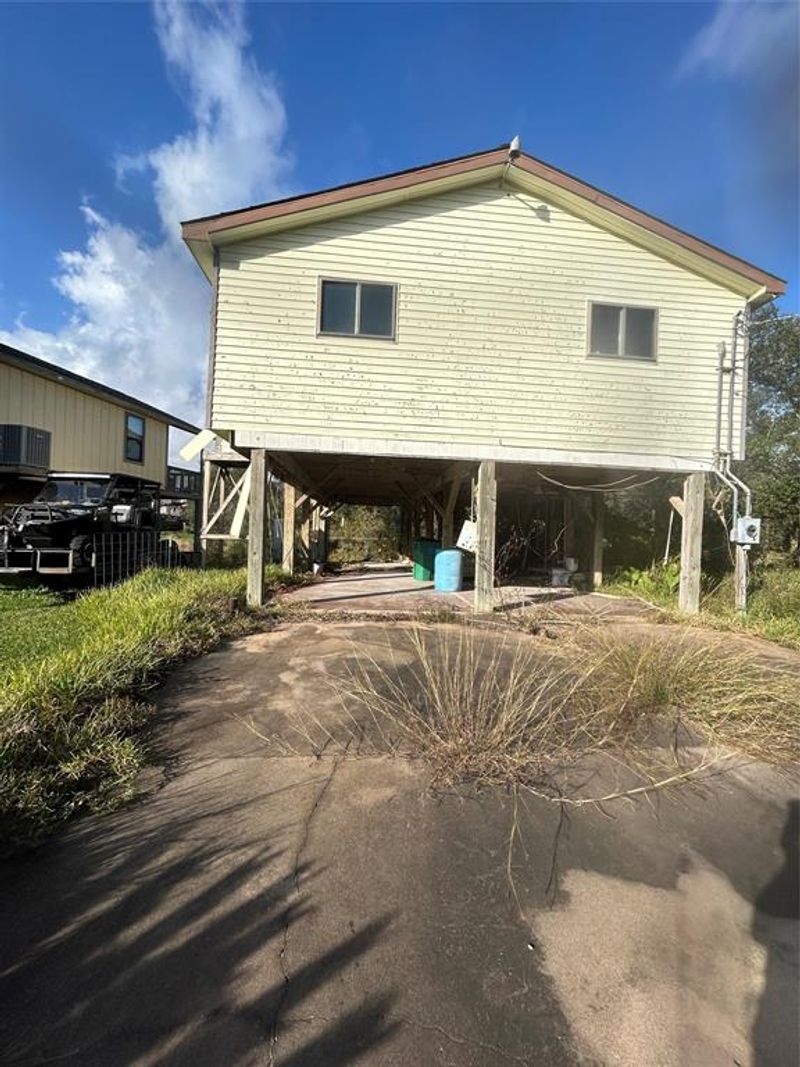
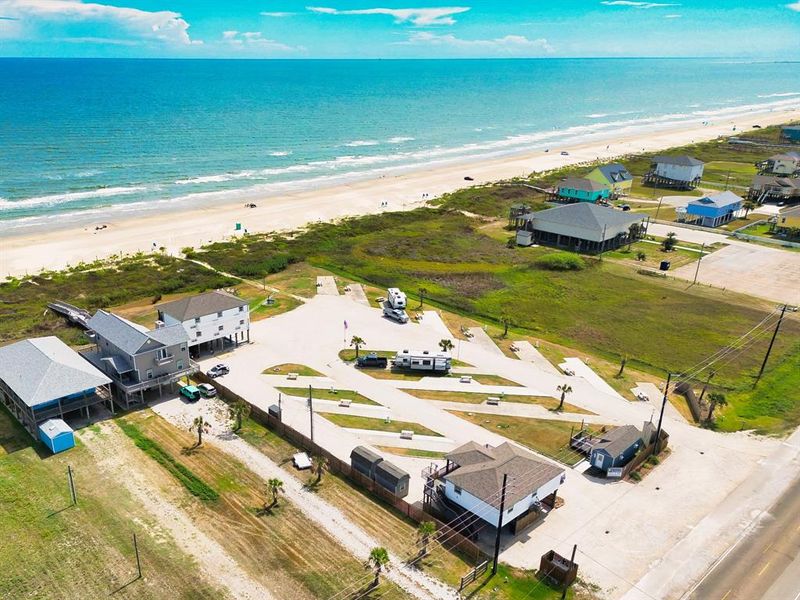
Sold Mar 19, 2025
$99,000
Last List Price
1 / 24
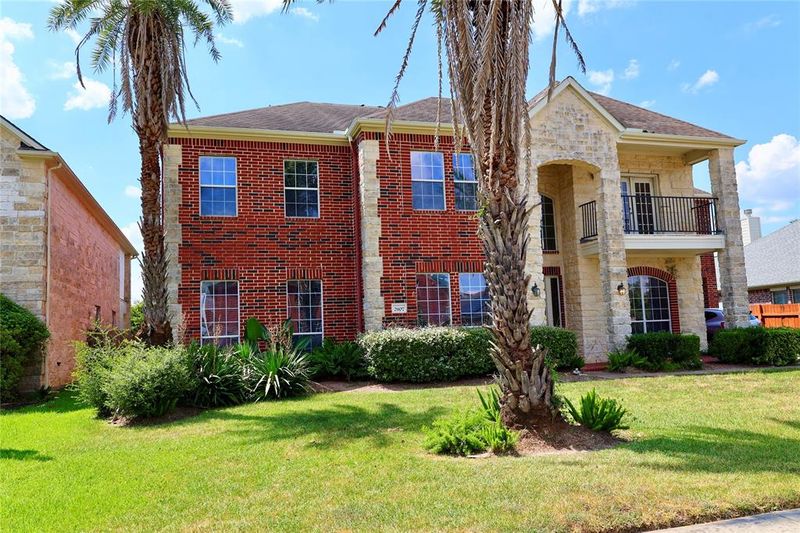
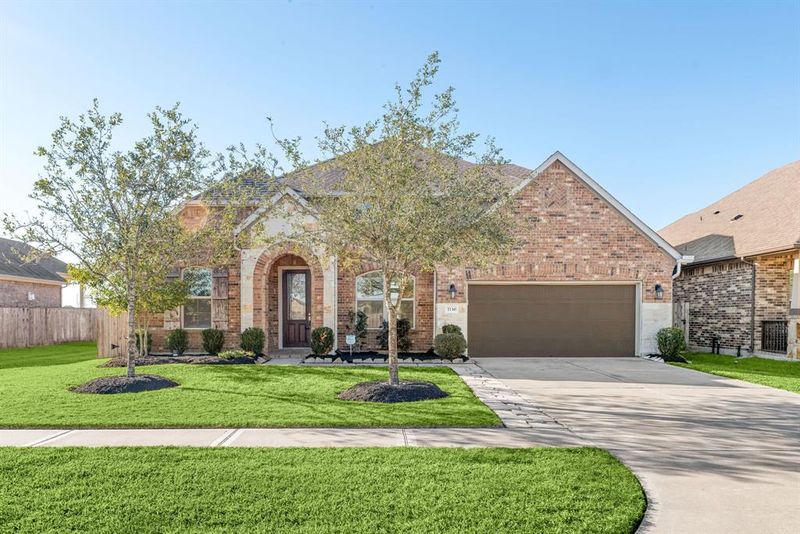
Sold Mar 12, 2025
$505,000
Last List Price

1 / 35
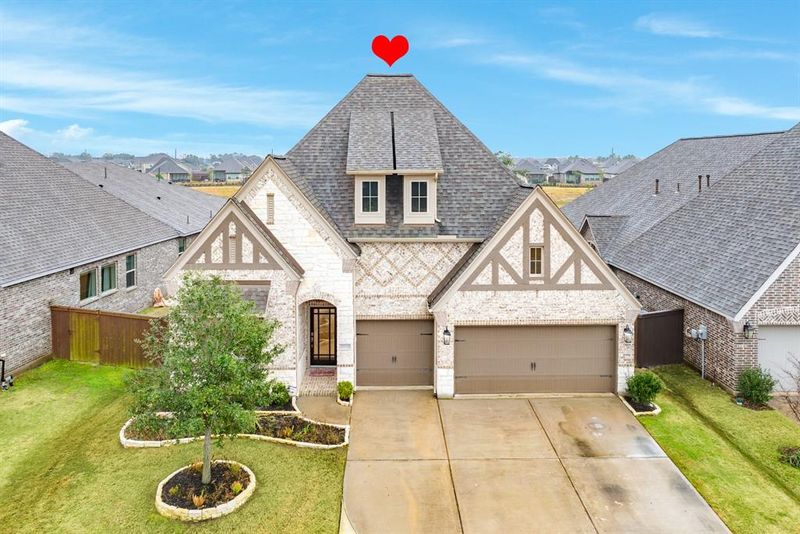
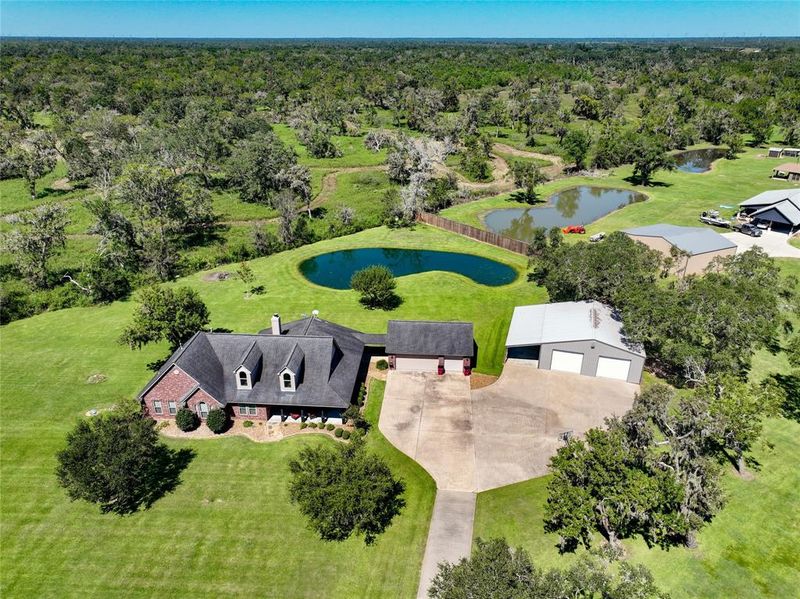
Sold Mar 12, 2025
$289,999
Last List Price
1 / 43
Sold Mar 11, 2025
$483,000
Last List Price
1 / 43
Sold Mar 11, 2025
$483,000
Last List Price
1 / 33
Sold Mar 06, 2025
$380,000
Last List Price
1 / 26
Sold Mar 05, 2025
$2,000,000
Last List Price
1 / 38
Sold Mar 04, 2025
$489,900
Last List Price
1 / 25
Sold Mar 03, 2025
$575,000
Last List Price

1 / 26
Sold Mar 03, 2025
$689,939
Last List Price
1 / 16
Sold Feb 28, 2025
$190,000
Last List Price
1 / 30
Sold Feb 27, 2025
$240,000
Last List Price

1 / 49
Sold Feb 24, 2025
$899,999
Last List Price
1 / 50
Sold Feb 21, 2025
$514,900
Last List Price
1 / 49
Sold Feb 18, 2025
$515,000
Last List Price
1 / 49
Sold Feb 18, 2025
$515,000
Last List Price

1 / 45
Sold Feb 14, 2025
$799,000
Last List Price
1 / 38
Sold Feb 14, 2025
$299,900
Last List Price

1 / 20
Sold Feb 14, 2025
$380,000
Last List Price
1 / 41
Sold Feb 14, 2025
$502,367
Last List Price

1 / 36
Sold Feb 07, 2025
$380,000
Last List Price

1 / 33
Sold Feb 07, 2025
$295,900
Last List Price
1 / 36
Sold Feb 07, 2025
$380,000
Last List Price
1 / 46
Sold Feb 06, 2025
$434,976
Last List Price

1 / 32
Sold Jan 31, 2025
$330,000
Last List Price

Sold Jan 31, 2025
$330,000
Last List Price
1 / 50
Sold Jan 31, 2025
$334,900
Last List Price

1 / 24
Sold Jan 27, 2025
$659,000
Last List Price
1 / 36
Sold Jan 23, 2025
$199,000
Last List Price

1 / 47
Sold Jan 16, 2025
$680,000
Last List Price
1 / 48
Sold Jan 16, 2025
$649,900
Last List Price
1 / 45
Sold Jan 13, 2025
$688,000
Last List Price
1 / 45
Sold Jan 13, 2025
$475,000
Last List Price

1 / 41
Sold Jan 10, 2025
$739,000
Last List Price
Viewing 181-216 of 2,276 homes
Brazoria County Market Trends
All Home Types
In the last 30 days, homes for sale in Brazoria County, TX sold for a median price of $342,297, down 1.9% compared to the same period last year. The median price per square foot was $162.56, up 1.9% year-over-year. There were 239 homes sold, down from 373 last year.
Median Sale Price
$342,297
-1.9% year-over-year
Median Price per Sq. Ft.
$162.56
+1.9% year-over-year
Number of Homes Sold
239
-35.9% year-over-year
Frequently Asked Questions
What is the median home sale price in Brazoria County, TX?
In the last 30 days, the median home sale price in Brazoria County was $342,297, down 1.9% compared to the same period last year. The "median" price is the middle price - half of the homes here were sold for less, the other half for more.
How many homes are for sale in Brazoria County, TX?
There were 2,412 homes for sale in Brazoria County as of November 07, 2025. There were 774 new listings within the last 30 days as well. The more homes on the market, the more choices buyers have.
What are some of the most popular neighborhoods in Brazoria County, TX?
According to our listings, you'll find the most homes currently available in Brazoria County in these popular neighborhoods: Pomona, Columbia Lakes, and Treasure Island / San Luis Pass.
How up-to-date are Orchard's new listings in Brazoria County, TX?
The new homes and houses for sale on Orchard's listings pages are updated hundreds of times each day, with listings in Brazoria County last seen updated at . New listings can appear every day, but many listings first appear on the market mid-week.
How much competition is there to buy a home in Brazoria County, TX?
In the last 30 days, the median number of days a home in Brazoria County remained on the market (DOM) was 46. In areas with a low DOM, homes are sold quickly and the competition is fierce; in areas with higher DOMs, you may have more options and more time to make an offer.