498 Homes
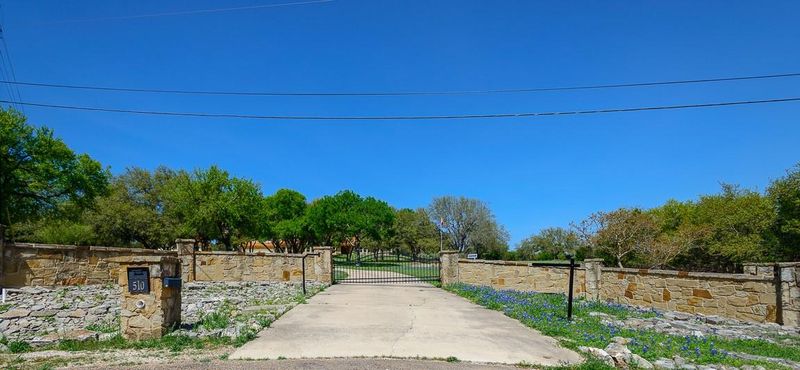
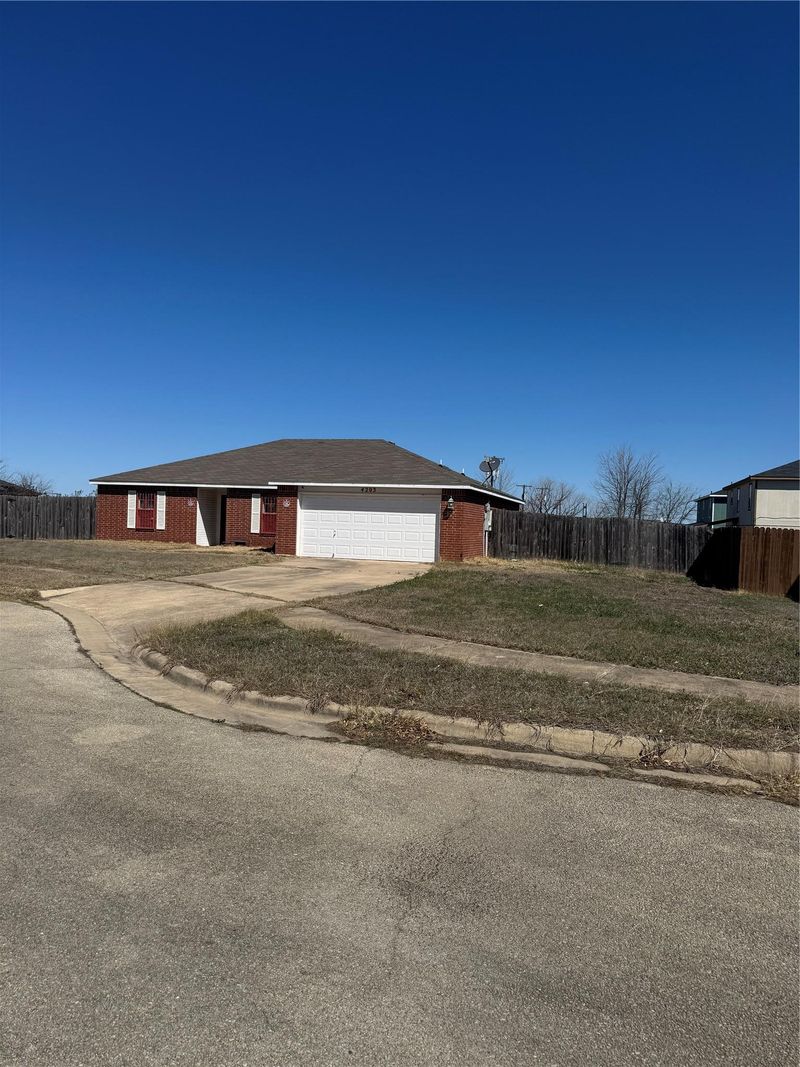
Recently sold homes in Bell County, TX on a Cul De Sac
In the last 30 days, Bell County home prices were up 0.4% compared to last year. The median price of a home was $281,411. View Bell County Market Insights

1 / 1
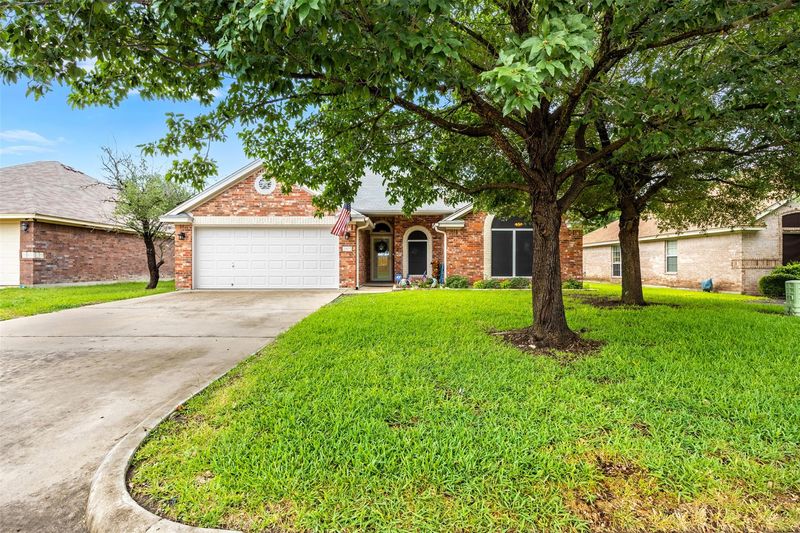
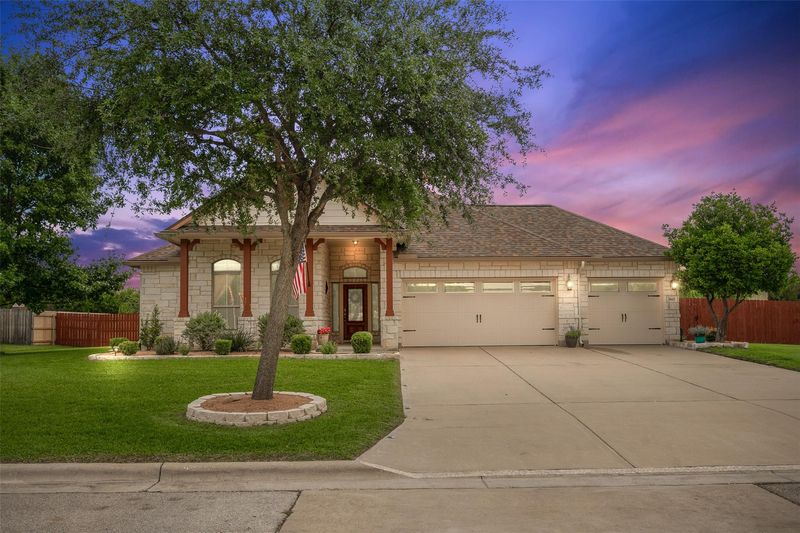
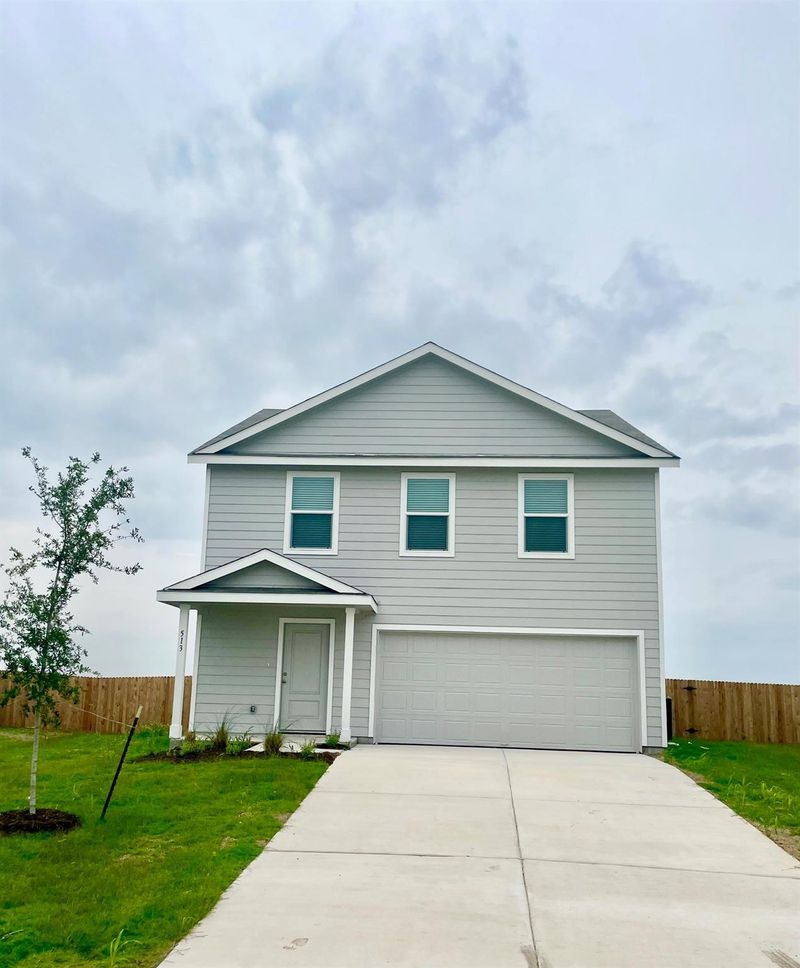
Sold Oct 23, 2025
$330,000
Last List Price

1 / 1
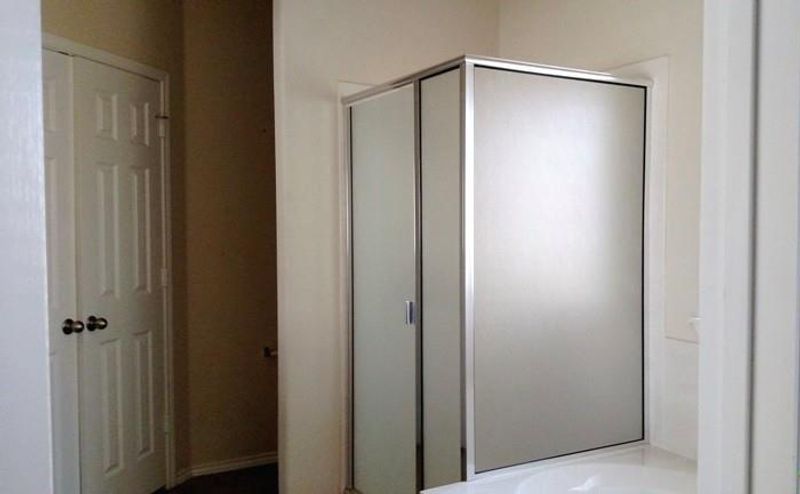
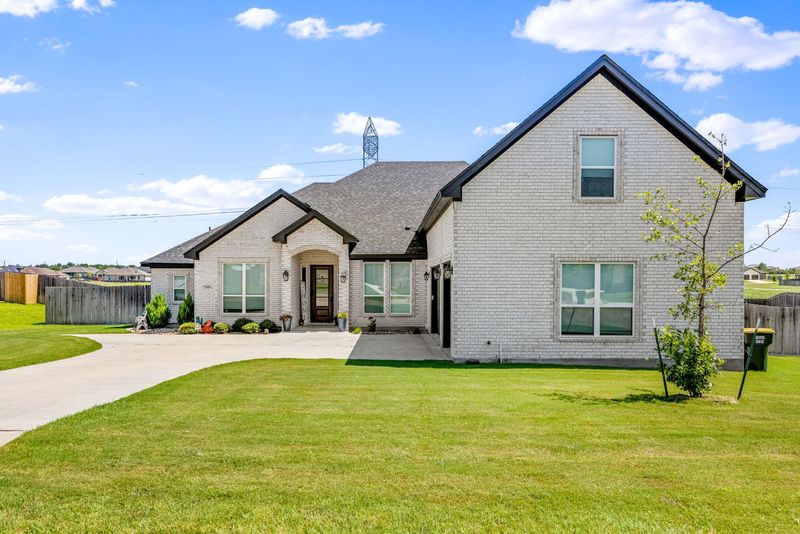
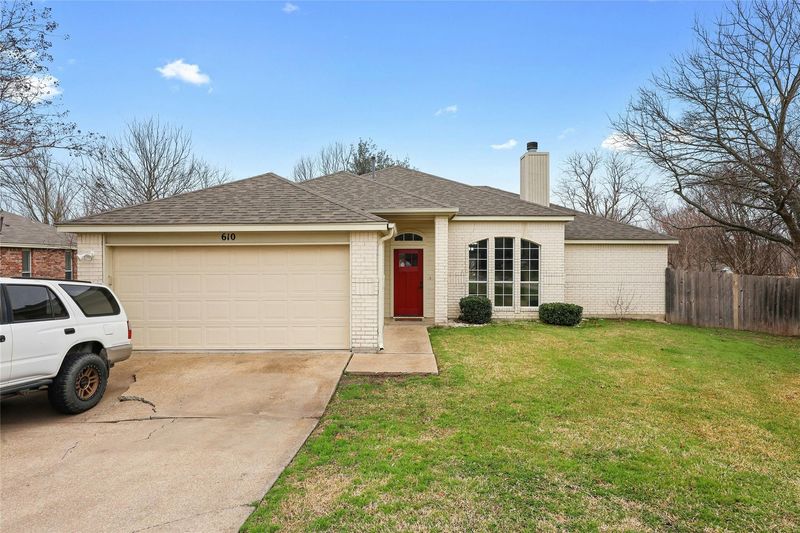
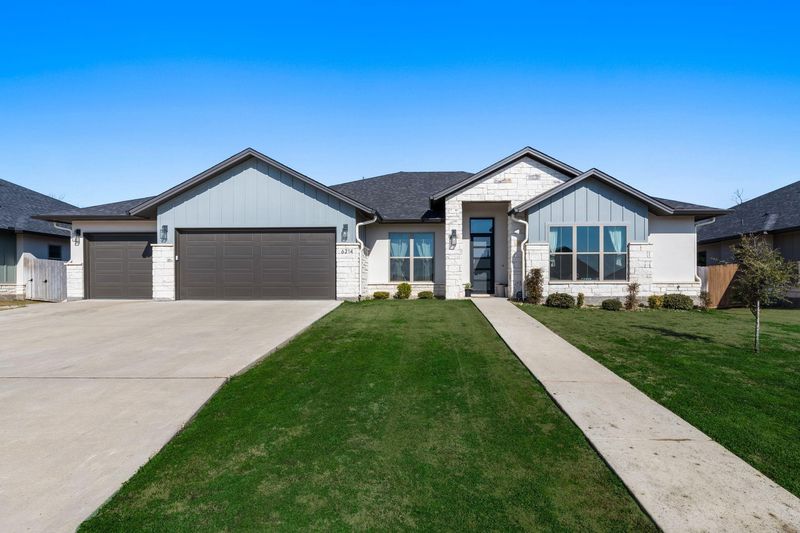
Sold Sep 30, 2025
$374,900
Last List Price
1 / 1
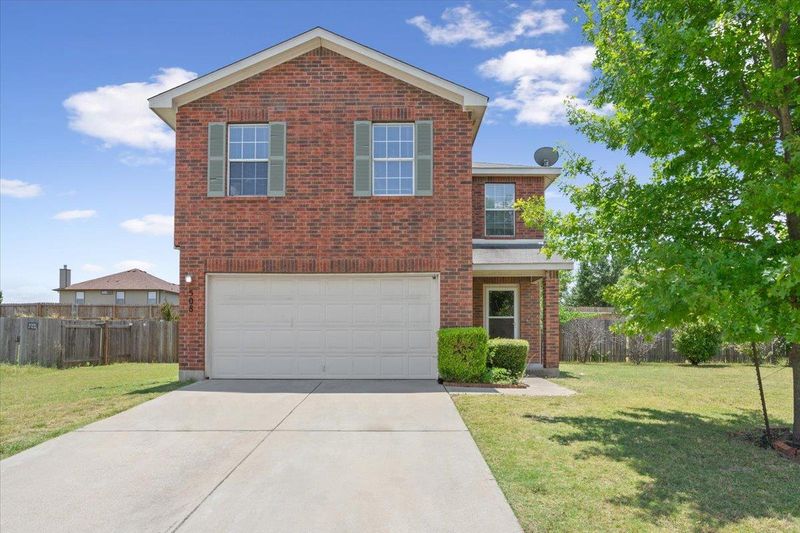
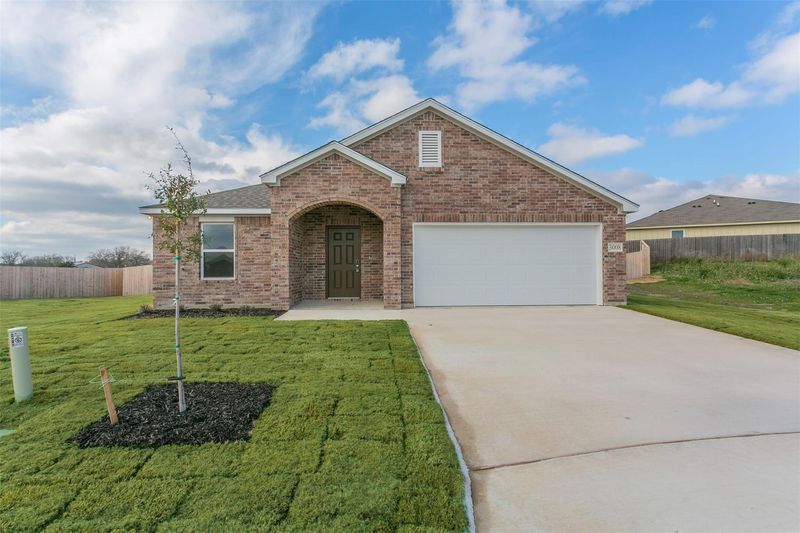
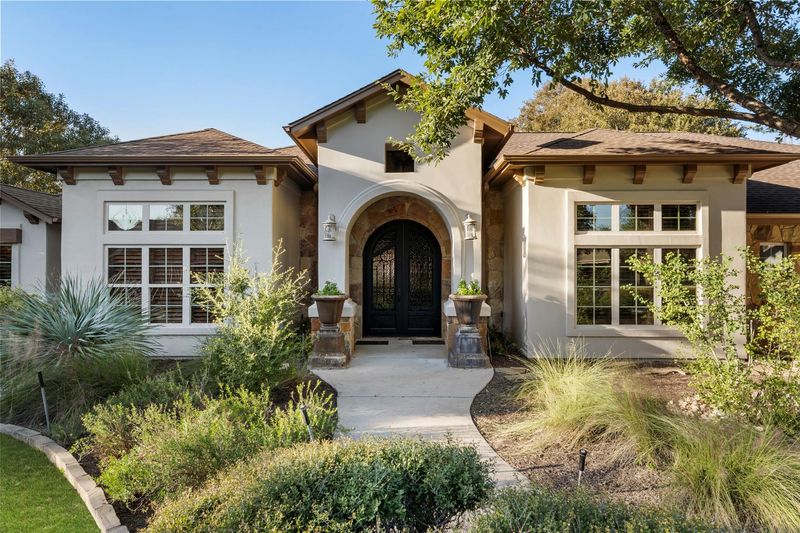
Sold Sep 26, 2025
$400,000
Last List Price

1 / 1
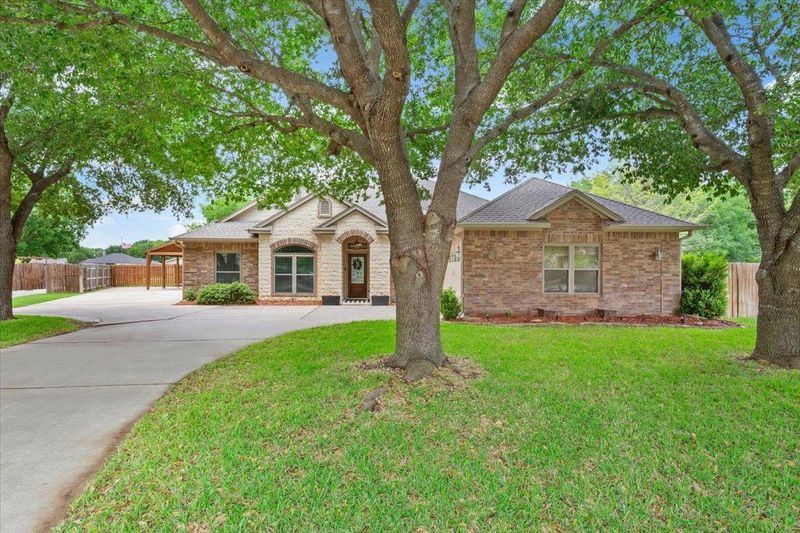
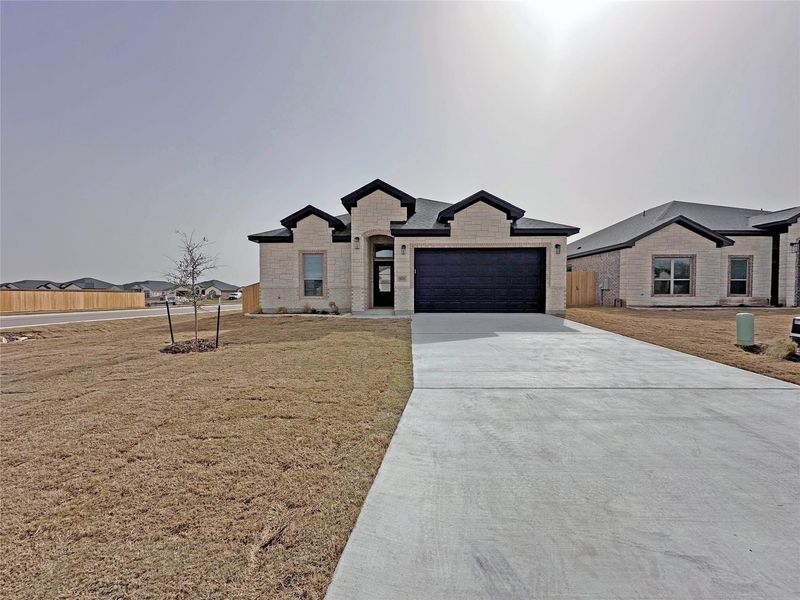
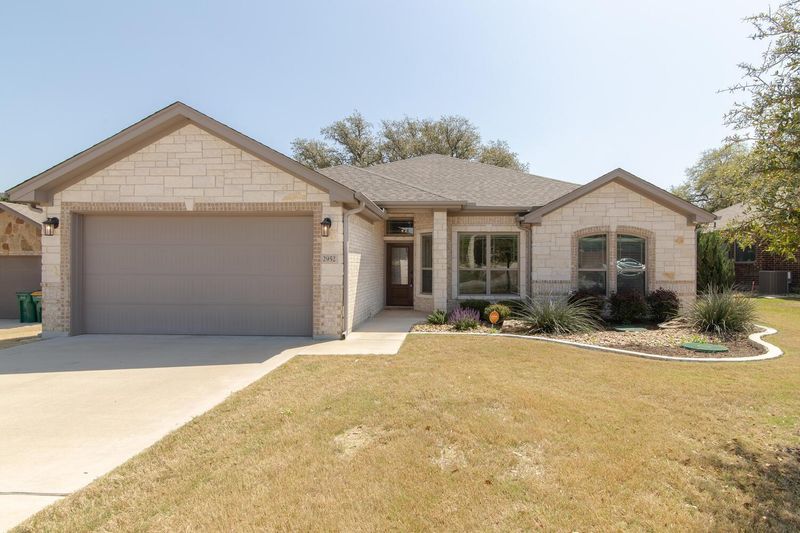
Sold Sep 11, 2025
$365,000
Last List Price
1 / 1
Sold Sep 09, 2025
$335,000
Last List Price
1 / 1
Sold Sep 05, 2025
$1,295,000
Last List Price
1 / 1
Sold Sep 03, 2025
$265,000
Last List Price
1 / 1
Sold Aug 28, 2025
$1,000,000
Last List Price

1 / 1
Sold Aug 25, 2025
$273,990
Last List Price
1 / 1
Sold Aug 25, 2025
$210,000
Last List Price
1 / 1
Sold Aug 11, 2025
$258,990
Last List Price
1 / 1
Sold Aug 11, 2025
$220,000
Last List Price
1 / 1
Sold Aug 11, 2025
$299,900
Last List Price
1 / 1
Sold Jul 24, 2025
$269,000
Last List Price
1 / 1
Sold Jul 15, 2025
$175,000
Last List Price
1 / 1
Sold Jul 15, 2025
$599,000
Last List Price
1 / 1
Sold Jul 07, 2025
$239,900
Last List Price
1 / 1
Sold Jul 07, 2025
$410,000
Last List Price
1 / 1
Sold Jun 26, 2025
$318,333
Last List Price

1 / 1
Sold Jun 26, 2025
$457,000
Last List Price

1 / 1
Sold Jun 26, 2025
$439,900
Last List Price
1 / 1
Sold Jun 18, 2025
$253,990
Last List Price

1 / 1
Sold Jun 17, 2025
$240,000
Last List Price
1 / 1
Sold Jun 16, 2025
$465,000
Last List Price
1 / 1
Sold Jun 13, 2025
$564,900
Last List Price

1 / 1
Sold Jun 06, 2025
$320,000
Last List Price
1 / 1
Sold Jun 06, 2025
$282,500
Last List Price
1 / 1
Sold Jun 05, 2025
$419,000
Last List Price
1 / 1
Sold May 30, 2025
$273,990
Last List Price
1 / 1
Sold May 27, 2025
$215,000
Last List Price
1 / 1
Sold May 22, 2025
$999,500
Last List Price

1 / 1
Sold May 12, 2025
$362,500
Last List Price
1 / 1
Sold May 09, 2025
$421,500
Last List Price
1 / 1
Sold May 02, 2025
$185,000
Last List Price
1 / 1
Sold May 01, 2025
$460,000
Last List Price

1 / 1
Sold May 01, 2025
$669,000
Last List Price
Viewing 1-36 of 498 homes
Bell County Market Trends
All Home Types
In the last 30 days, homes for sale in Bell County, TX sold for a median price of $281,411, up 0.4% compared to the same period last year. The median price per square foot was $151.59, down 3.6% year-over-year. There were 199 homes sold, down from 358 last year.
Median Sale Price
$281,411
+0.4% year-over-year
Median Price per Sq. Ft.
$151.59
-3.6% year-over-year
Number of Homes Sold
199
-44.4% year-over-year
Frequently Asked Questions
What is the median home sale price in Bell County, TX?
In the last 30 days, the median home sale price in Bell County was $281,411, up 0.4% compared to the same period last year. The "median" price is the middle price - half of the homes here were sold for less, the other half for more.
How many homes are for sale in Bell County, TX?
There were 2,397 homes for sale in Bell County as of November 03, 2025. There were 635 new listings within the last 30 days as well. The more homes on the market, the more choices buyers have.
What are some of the most popular neighborhoods in Bell County, TX?
According to our listings, you'll find the most homes currently available in Bell County in these popular neighborhoods: Skipcha Mountain, Mill Creek, and White Rock Estates.
How up-to-date are Orchard's new listings in Bell County, TX?
The new homes and houses for sale on Orchard's listings pages are updated hundreds of times each day, with listings in Bell County last seen updated at . New listings can appear every day, but many listings first appear on the market mid-week.
How much competition is there to buy a home in Bell County, TX?
In the last 30 days, the median number of days a home in Bell County remained on the market (DOM) was 69.63. In areas with a low DOM, homes are sold quickly and the competition is fierce; in areas with higher DOMs, you may have more options and more time to make an offer.