17,812 Homes
Recently sold homes in Johnson County, TX under $700,000
In the last 30 days, Johnson County home prices were up 0.6% compared to last year. The median price of a home was $349,900. View Johnson County Market Insights

1 / 1
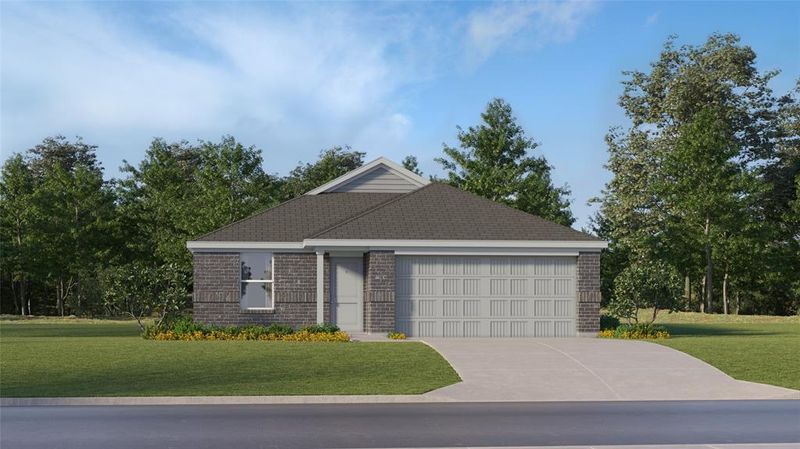
Sold Oct 21, 2025
$203,000
Last List Price

1 / 1
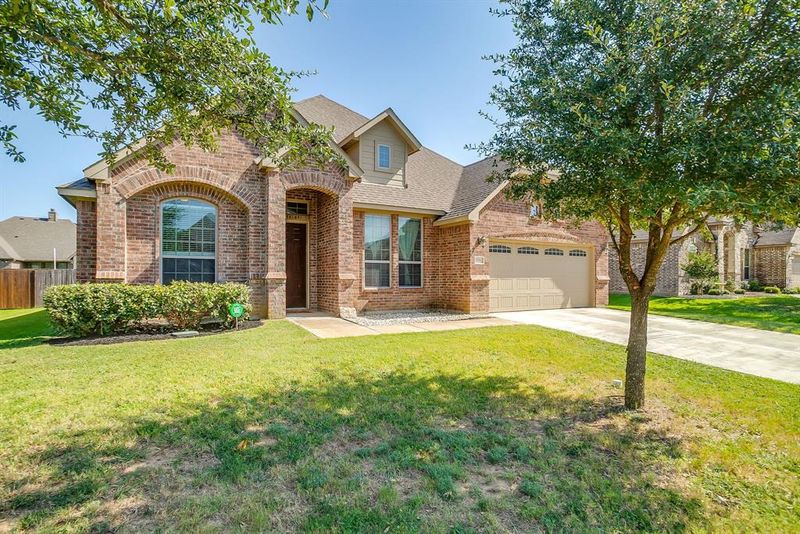
Sold Oct 21, 2025
$695,734
Last List Price

1 / 1
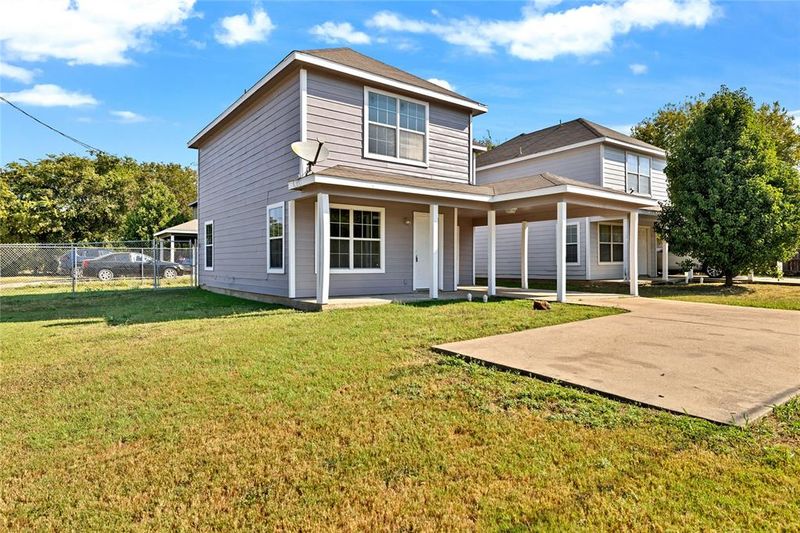
Sold Oct 21, 2025
$175,000
Last List Price

1 / 1
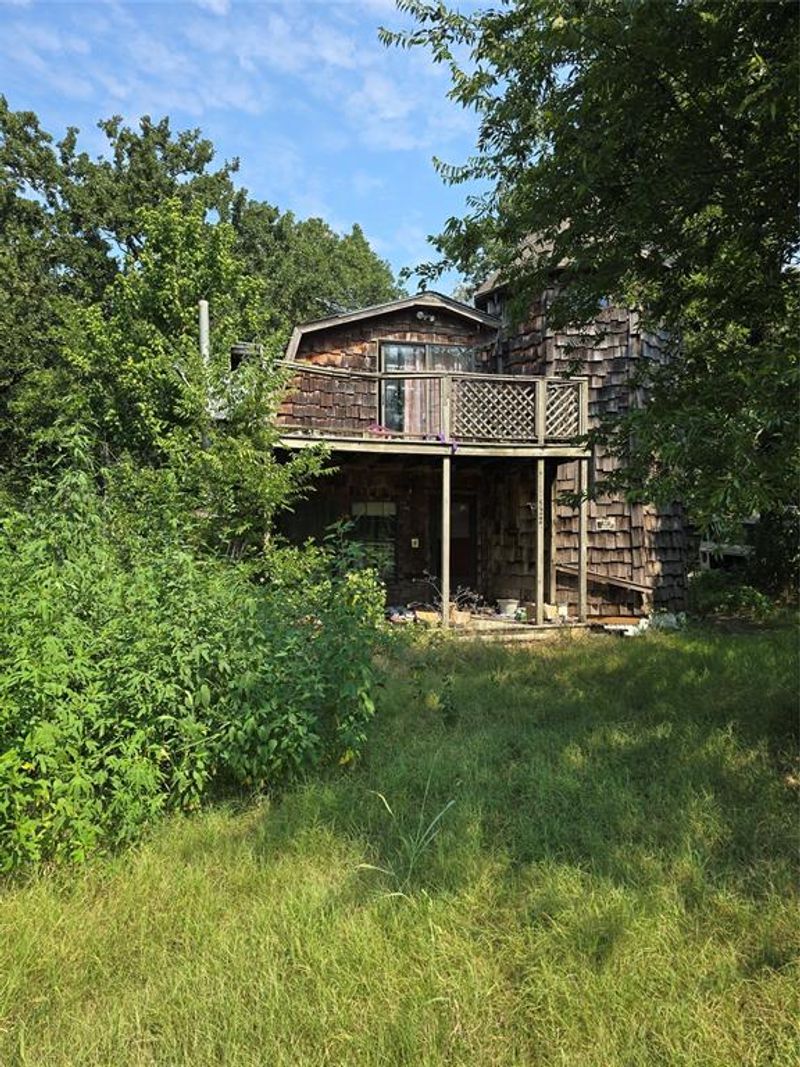
Sold Oct 21, 2025
$215,000
Last List Price
1 / 1
Sold Oct 20, 2025
$231,049
Last List Price
1 / 1
Sold Oct 20, 2025
$364,000
Last List Price
1 / 1
Sold Oct 20, 2025
$199,900
Last List Price

1 / 1
Sold Oct 20, 2025
$579,900
Last List Price
1 / 1
Sold Oct 20, 2025
$99,999
Last List Price

1 / 1
Sold Oct 20, 2025
$528,000
Last List Price

1 / 1
Sold Oct 20, 2025
$658,432
Last List Price

1 / 1
Sold Oct 20, 2025
$301,900
Last List Price

1 / 1
Sold Oct 20, 2025
$430,000
Last List Price

1 / 1
Sold Oct 20, 2025
$289,350
Last List Price

1 / 1
Sold Oct 20, 2025
$449,500
Last List Price
1 / 1
Sold Oct 17, 2025
$598,900
Last List Price

1 / 1
Sold Oct 17, 2025
$254,995
Last List Price

1 / 1
Sold Oct 17, 2025
$315,990
Last List Price

1 / 1
Sold Oct 17, 2025
$380,000
Last List Price
1 / 1
Sold Oct 17, 2025
$399,999
Last List Price

1 / 1
Sold Oct 17, 2025
$429,770
Last List Price
1 / 1
Sold Oct 17, 2025
$490,000
Last List Price

1 / 1
Sold Oct 17, 2025
$355,000
Last List Price
1 / 1
Sold Oct 17, 2025
$399,635
Last List Price

1 / 1
Sold Oct 17, 2025
$492,000
Last List Price
1 / 1
Sold Oct 17, 2025
$215,000
Last List Price
1 / 1
Sold Oct 17, 2025
$274,990
Last List Price

1 / 1
Sold Oct 17, 2025
$302,900
Last List Price
1 / 1
Sold Oct 17, 2025
$535,000
Last List Price
1 / 1
Sold Oct 17, 2025
$399,900
Last List Price
1 / 1
Sold Oct 17, 2025
$304,990
Last List Price
1 / 1
Sold Oct 17, 2025
$217,900
Last List Price
1 / 1
Sold Oct 17, 2025
$213,999
Last List Price
1 / 1
Sold Oct 16, 2025
$299,000
Last List Price

1 / 1
Sold Oct 16, 2025
$409,900
Last List Price

1 / 1
Sold Oct 16, 2025
$259,900
Last List Price
Viewing 73-108 of 17,812 homes
Johnson County Market Trends
All Home Types
In the last 30 days, homes for sale in Johnson County, TX sold for a median price of $349,900, up 0.6% compared to the same period last year. The median price per square foot was $177.57, up 0.3% year-over-year. There were 121 homes sold, down from 252 last year.
Median Sale Price
$349,900
+0.6% year-over-year
Median Price per Sq. Ft.
$177.57
+0.3% year-over-year
Number of Homes Sold
121
-52% year-over-year
Frequently Asked Questions
What is the median home sale price in Johnson County, TX?
In the last 30 days, the median home sale price in Johnson County was $349,900, up 0.6% compared to the same period last year. The "median" price is the middle price - half of the homes here were sold for less, the other half for more.
How many homes are for sale in Johnson County, TX?
There were 1,424 homes for sale in Johnson County as of November 01, 2025. There were 392 new listings within the last 30 days as well. The more homes on the market, the more choices buyers have.
How up-to-date are Orchard's new listings in Johnson County, TX?
The new homes and houses for sale on Orchard's listings pages are updated hundreds of times each day, with listings in Johnson County last seen updated at . New listings can appear every day, but many listings first appear on the market mid-week.
How much competition is there to buy a home in Johnson County, TX?
In the last 30 days, the median number of days a home in Johnson County remained on the market (DOM) was 53. In areas with a low DOM, homes are sold quickly and the competition is fierce; in areas with higher DOMs, you may have more options and more time to make an offer.